
Category: Data visualization
-
From Static Scripts to Smart Agents: A New Era in Financial Analysis

Static financial scripts create bottlenecks that can’t keep pace with the market. This post demonstrates a more powerful approach: building an AI agent that understands natural language. It details a method to transform rigid code into a dynamic analytical engine that generates practical, interactive dashboards from simple, conversational commands.
-
Harnessing LLMs for Financial Visualization: An Experiment with Claude
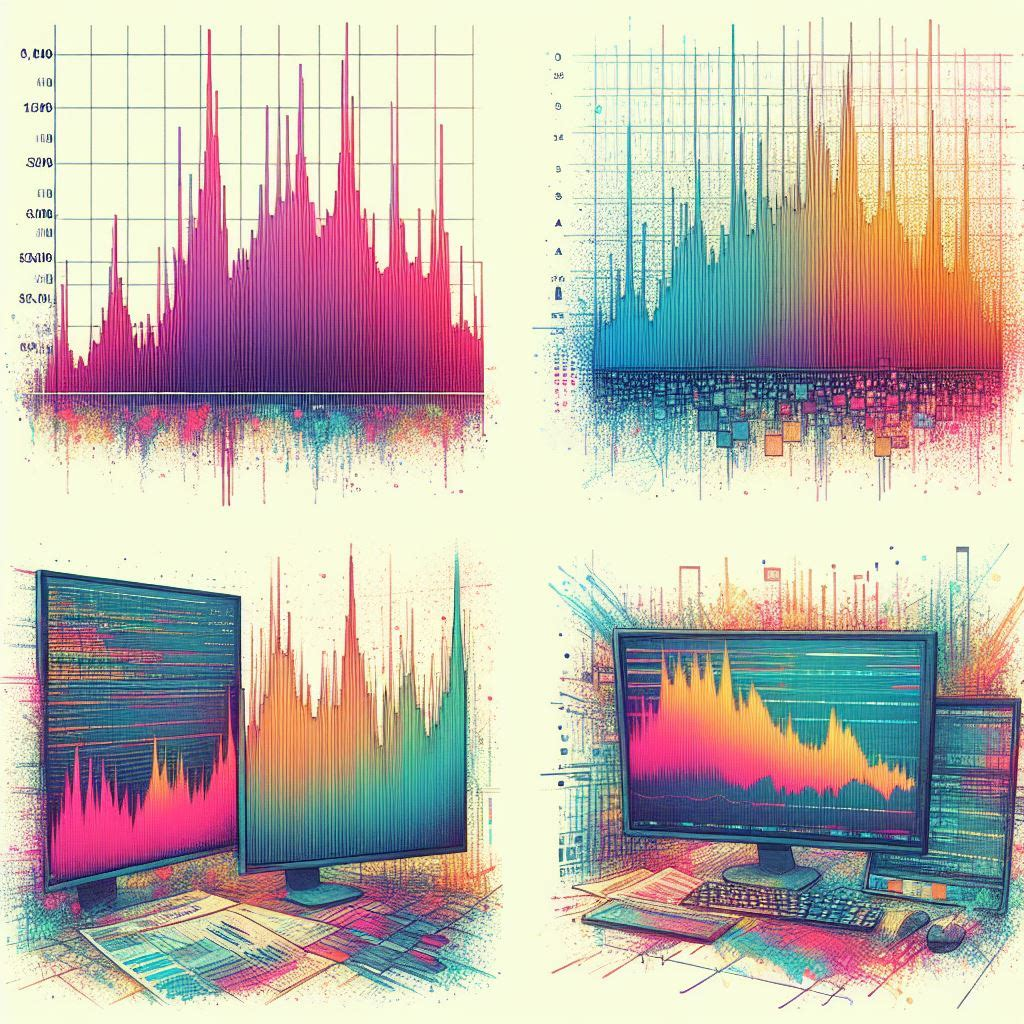
This post explores using Large Language Models (LLMs) for visual input in coding. We demonstrate this with Claude generating Python code for a financial chart.
-
Chatbot Showdown: Can Claude dethrone ChatGPT?

Anthropic’s Claude 3 model family, released on March 4, 2024, intensifies chatbot competition. It consists of three increasingly powerful models—Haiku, Sonnet, and Opus. This post directly compares Claude 3 Sonnet to ChatGPT 3.5 through various tests.
-
Elevate your Data Visualization Skills with ChatGPT
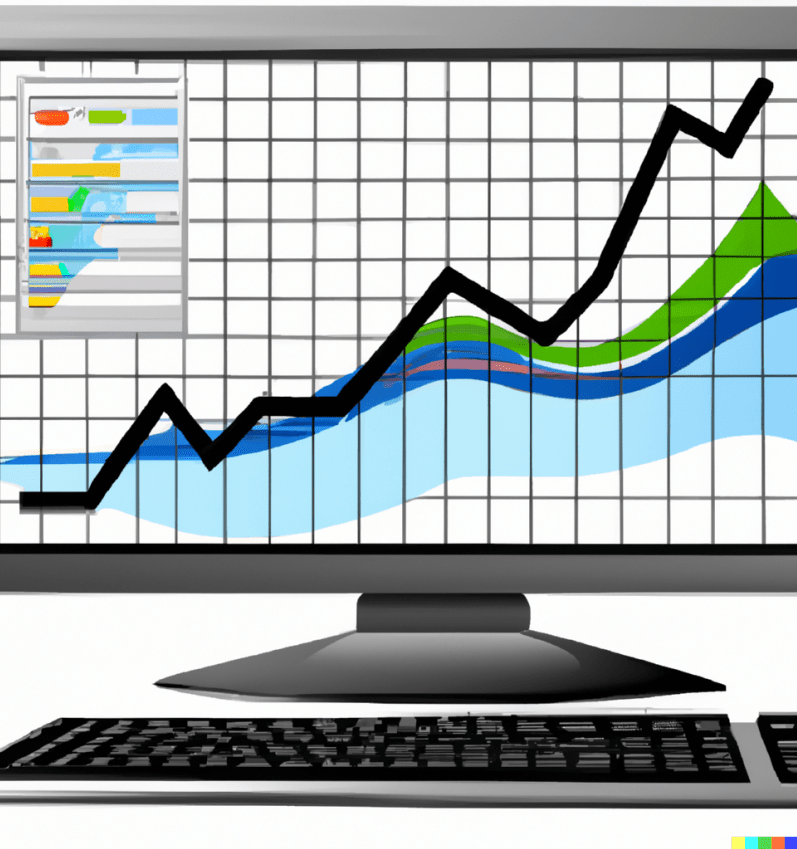
Data visualization is a powerful way to convey insights from raw data. In this post, we will illustrate how ChatGPT can help generate captivating data visuals using Python libraries such as Matplotlib and Seaborn.
